
If you or someone you know is struggling with substance use or in crisis, help is available. Call or text 988 to reach the 988 Suicide & Crisis Lifeline, available 24/7. For substance use treatment referrals, call SAMHSA’s National Helpline at 1-800-662-HELP (4357).
The opioid epidemic has killed more than 600,000 Americans since 1999, reshaping communities, overwhelming healthcare systems, and exposing deep fault lines in how the country addresses substance use disorders. But the crisis has never affected every state equally.
While recent CDC data shows the first sustained decline in overdose deaths nationally — a 26.2% decrease from 2023 to 2024 — behind this encouraging headline, the state-level picture remains uneven (CDC, 2025). Some states are seeing dramatic improvements. Others continue to report devastating losses.
Opioid use disorder statistics show the full scope of the condition’s prevalence across the United States. This article examines how the epidemic varies by state, what’s driving the differences, and where treatment access remains critically inadequate.
The Current State of the Opioid Epidemic
The CDC reports that approximately 105,000 people died from drug overdose in 2023, with nearly 80,000 (76%) involving opioids (CDC, 2024). However, 2024 data shows a significant decline — the first sustained drop in overdose deaths in years.
Key national trends:
- The age-adjusted drug overdose death rate decreased between 2022 and 2024, with the largest decrease (26.2%) from 2023 to 2024 (CDC, 2025)
- Synthetic opioids (primarily fentanyl) remain the dominant driver — involved in the vast majority of opioid deaths
- Polysubstance use is increasingly common — stimulants (methamphetamine, cocaine) combined with opioids now account for a growing share of deaths
- The demographic profile has shifted: overdose deaths are increasing fastest among Black and Native American communities
Despite the recent decline, the death toll remains historically extraordinary. More Americans die from drug overdoses each year than died in the entire Vietnam War.
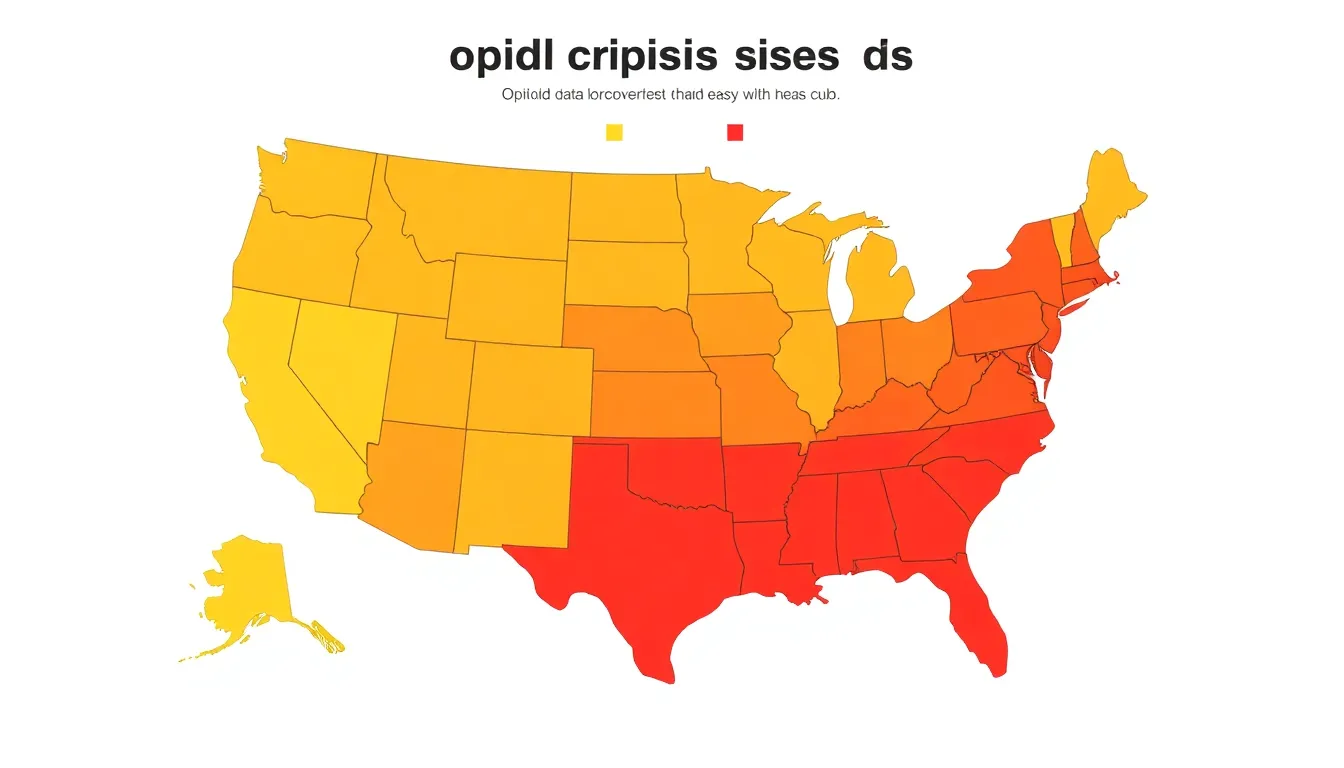
Overdose Deaths by State: The Latest Data
The CDC’s Vital Statistics Rapid Release system provides monthly provisional overdose death counts by state (CDC, 2024). States consistently reporting the highest age-adjusted overdose death rates include:
Highest overdose death rates (per 100,000):
- West Virginia — Consistently the highest in the nation, often 2-3x the national average
- Tennessee — Severe fentanyl penetration in both urban and rural communities
- Louisiana — Rising rates driven by fentanyl and limited treatment infrastructure
- Ohio — Early epicenter of the prescription opioid wave, now battling fentanyl. Ohio mental health statistics reflect the broader impact on state mental health
- Kentucky — Appalachian communities devastated by the full arc of the epidemic: prescription opioids, heroin, then fentanyl
Lowest overdose death rates:
- Nebraska — Lower rates attributed to rural geography limiting drug supply chains and relatively strong community networks
- South Dakota — Similar protective factors, though methamphetamine is a growing concern
- Iowa — Below-average rates but trending upward with fentanyl spread
States showing the most improvement (2023-2024):
- North Carolina — Aggressive naloxone distribution and expanded MAT access
- Vermont — Hub-and-spoke treatment model widely cited as a national model
- Pennsylvania — Warm handoff programs connecting ER patients directly to treatment
The variation is stark: the highest-rate state has an overdose death rate roughly 4-5 times that of the lowest-rate state. Geography, policy, and treatment infrastructure explain most of the difference.
The Fentanyl Factor: How Synthetic Opioids Changed Everything
The opioid epidemic has evolved through three distinct waves:
Wave 1 (1999-2010): Prescription opioids. Aggressive pharmaceutical marketing led to massive overprescribing of oxycodone, hydrocodone, and other prescription painkillers. States with higher prescribing rates — Appalachia, the South, rural areas — were hit first.
Wave 2 (2010-2013): Heroin. As prescription opioids became harder to obtain (reformulation, prescribing restrictions), many users transitioned to cheaper, more available heroin. Overdose deaths from heroin tripled during this period.
Wave 3 (2013-present): Synthetic opioids. Illicitly manufactured fentanyl — 50-100x more potent than morphine — flooded the drug supply. Fentanyl is now found in heroin, counterfeit pills, cocaine, and methamphetamine, often without users’ knowledge. This wave produced the steepest increase in deaths and remains the dominant threat.
The CDC’s SUDORS (State Unintentional Drug Overdose Reporting System) dashboard shows that fentanyl is now involved in the majority of overdose deaths across nearly all reporting jurisdictions (CDC, 2024). States where fentanyl penetrated the drug supply earliest (the Northeast, Ohio Valley) were hit first; western states saw fentanyl arrive later but are now experiencing rapid increases.
States Hardest Hit: West Virginia, Ohio, Tennessee
West Virginia
West Virginia exemplifies how multiple vulnerabilities converge. The state has:
- The highest overdose death rate in the nation
- High poverty and unemployment
- Severe provider shortages, especially in rural southern counties
- A history of prescription opioid overprescribing by pill mills
- Limited treatment infrastructure — few MAT providers per capita
Ohio
Ohio was among the first states to experience all three waves. Dayton, Ohio was once called the “overdose capital of America.” The state has invested heavily in naloxone distribution, quick-response teams, and expanding MAT, and has seen some improvement — but rates remain well above the national average.
Tennessee
Tennessee’s crisis has been amplified by fentanyl’s rapid spread through both urban (Memphis, Nashville) and rural communities. The state has expanded access to naloxone and syringe services, but treatment capacity remains insufficient.
States Making Progress: What’s Working
Several states have achieved measurable reductions through policy and infrastructure investment:
Vermont’s hub-and-spoke model: Vermont organizes OUD treatment around regional “hubs” (specialized treatment centers providing induction and stabilization) feeding into “spokes” (primary care providers maintaining patients on medication). This model has been replicated in other states and is credited with making MAT accessible even in rural areas.
Rhode Island’s correctional treatment program: Rhode Island became the first state to offer all three FDA-approved medications for OUD (methadone, buprenorphine, naltrexone) to every incarcerated person. Post-release overdose deaths dropped 61%.
North Carolina’s naloxone expansion: Aggressive naloxone distribution — including standing orders allowing pharmacies to dispense without individual prescriptions — has saved thousands of lives and contributed to declining death rates.
Common elements in successful states: expanded MAT access, naloxone availability, harm reduction approaches, integration of behavioral health with primary care, and criminal justice reform that prioritizes treatment over incarceration.
The Treatment Gap: Access to MAT by State
Medication-assisted treatment (MAT) — using buprenorphine, methadone, or naltrexone combined with behavioral therapy — is the gold standard for opioid use disorder treatment. SAMHSA reports that this combination “successfully treats SUDs and helps sustain recovery” (SAMHSA, 2025).
But access is wildly uneven:
- Some states have fewer than 5 buprenorphine providers per 100,000 residents
- Methadone can only be dispensed through certified Opioid Treatment Programs (OTPs), which are concentrated in urban areas
- Rural communities face limited treatment access — many rural counties have zero OTPs and few buprenorphine prescribers
- Insurance barriers persist: some state Medicaid programs limit MAT coverage duration or require prior authorization
Substance use disorder data shows the broader context — opioid use disorder exists within a larger substance use landscape that includes alcohol use disorder and polysubstance use.
What the Numbers Tell Us About Solutions
The data points toward clear policy directions:
- Expand MAT access — States with more MAT providers per capita have lower overdose death rates
- Distribute naloxone widely — Every life saved by naloxone is a person who can enter treatment
- Integrate behavioral health — Co-occurring depression, PTSD, and anxiety drive opioid use; treating them reduces relapse
- Address social determinants — Poverty, unemployment, housing instability, and ACEs are upstream drivers
- Reform criminal justice approaches — Treatment in lieu of incarceration produces better outcomes and lower costs
- Invest in data infrastructure — States with better real-time overdose surveillance can respond faster to emerging threats
The recent national decline in overdose deaths is encouraging — but fragile. Continued progress requires sustained investment, not complacency.
Frequently Asked Questions
Which state has the worst opioid problem?
West Virginia consistently has the highest age-adjusted overdose death rate in the nation, often 2-3 times the national average. However, “worst” depends on the metric — other states may have more total deaths (due to larger populations) or faster-rising rates. Tennessee, Louisiana, Ohio, and Kentucky also rank among the hardest hit.
Are opioid overdose deaths actually declining?
Yes, nationally. CDC data shows a 26.2% decrease in drug overdose deaths from 2023 to 2024 — the first sustained decline in years. However, this decline is not uniform across states. Some states continue to see rising rates, and the national death toll remains historically high at roughly 80,000+ opioid-related deaths per year.
What is fentanyl and why is it driving the crisis?
Fentanyl is a synthetic opioid 50-100 times more potent than morphine. Illicitly manufactured fentanyl has flooded the U.S. drug supply since approximately 2013, often mixed into heroin, counterfeit pills, cocaine, and methamphetamine — frequently without users’ knowledge. Its extreme potency means that even tiny dosing errors are fatal. Fentanyl is now involved in the majority of opioid overdose deaths nationwide.
What is MAT and does it work?
Medication-assisted treatment (MAT) combines FDA-approved medications — buprenorphine, methadone, or naltrexone — with behavioral therapy to treat opioid use disorder. SAMHSA reports that MAT improves patient survival, increases treatment retention, decreases illicit opioid use, and increases patients’ ability to gain employment. It is considered the gold standard for OUD treatment by every major medical organization.
How can I find opioid treatment in my state?
SAMHSA’s treatment locator (findtreatment.gov) can help find providers near you. You can also call SAMHSA’s National Helpline at 1-800-662-4357 (free, confidential, 24/7). For veterans, VA healthcare provides MAT at no cost. Many states also have their own treatment locator tools and crisis lines.
Sources
-
Centers for Disease Control and Prevention. Provisional drug overdose death counts. CDC NCHS VSRR; 2024. https://www.cdc.gov/nchs/nvss/vsrr/drug-overdose-data.htm
-
Centers for Disease Control and Prevention. Drug overdose deaths in the United States, 2023-2024. NCHS Data Brief No. 549; 2025. https://www.cdc.gov/nchs/products/databriefs/db549.htm
-
Centers for Disease Control and Prevention. Understanding the opioid overdose epidemic. CDC; 2024. https://www.cdc.gov/overdose-prevention/about/understanding-the-opioid-overdose-epidemic.html
-
Centers for Disease Control and Prevention. SUDORS dashboard: fatal drug overdose data. CDC; 2024. https://www.cdc.gov/overdose-prevention/data-research/facts-stats/sudors-dashboard-fatal-overdose-data.html
-
Substance Abuse and Mental Health Services Administration. Substance use disorder treatment options. SAMHSA; 2025. https://www.samhsa.gov/substance-use/treatment/options
-
Substance Abuse and Mental Health Services Administration. 2024 NSDUH releases. SAMHSA; 2024. https://www.samhsa.gov/data/data-we-collect/nsduh-national-survey-drug-use-and-health/national-releases/2024
-
National Alliance on Mental Illness. Mental health by the numbers. NAMI; 2024. https://www.nami.org/mental-health-by-the-numbers/
-
Substance Abuse and Mental Health Services Administration. Release of 2024 NSDUH data. SAMHSA Blog; 2024. https://www.samhsa.gov/blog/release-2024-nsduh-leveraging-latest-substance-use-mental-health-data-make-america-healthy-again